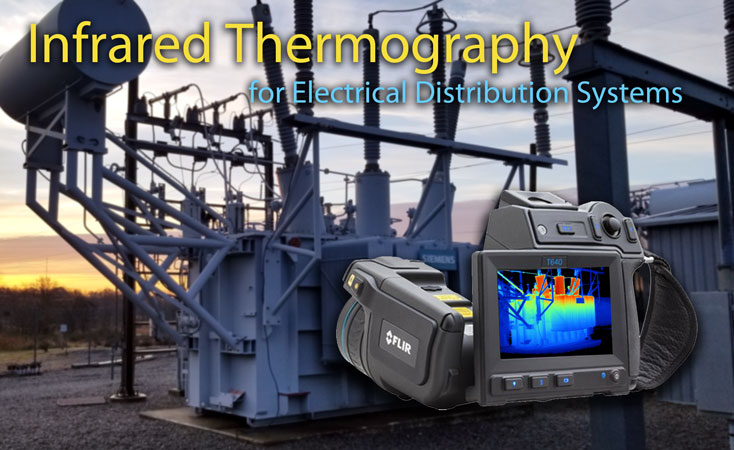
This guide provides a basic overview of the theory and procedures involved with infrared scanning electrical distribution systems. Photo: TestGuy
It’s well-known that the heat produced from high electrical resistance typically precedes electrical failures. For this reason, infrared scanning is an essential measure for troubleshooting, diagnostics, and preventive maintenance in electrical power distribution applications.
Thermal imagers are most commonly used for inspecting the integrity of electrical systems because test procedures are non-contact and can be performed quickly with equipment in service. Comparing the thermal signature of normally operating equipment to the one being evaluated for abnormal conditions offers an excellent means of troubleshooting.
Even if an abnormal thermal image is not fully understood, it can be used to determine if further testing may be required. Correctly identifying and interpreting thermal abnormalities requires not only a background in the application of thermography but also more extensive training and hands-on experience.
This guide provides a basic overview of the theory and procedures involved with the thermographic inspection of electrical distribution systems.
Guide Contents
- Basic Principles and Infrared Theory
- Infrared Camera Basics
- Important Safety Considerations
- Inspection Procedures
- Results and Reporting
- References
Basic Principles and Infrared Theory
Electromagnetic energy is radiation in the form of waves that comprise electric and magnetic properties. Electromagnetic waves can take on several forms such as light, radio frequency, and infrared radiation - the primary difference among all of these forms is their wavelength.
Thermal radiation is the movement of heat that occurs as radiant energy (electromagnetic waves), which moves without a direct medium of transfer. Infrared thermography is the science of using electronic optical devices to detect and measure thermal radiation and correlating that to surface temperature.
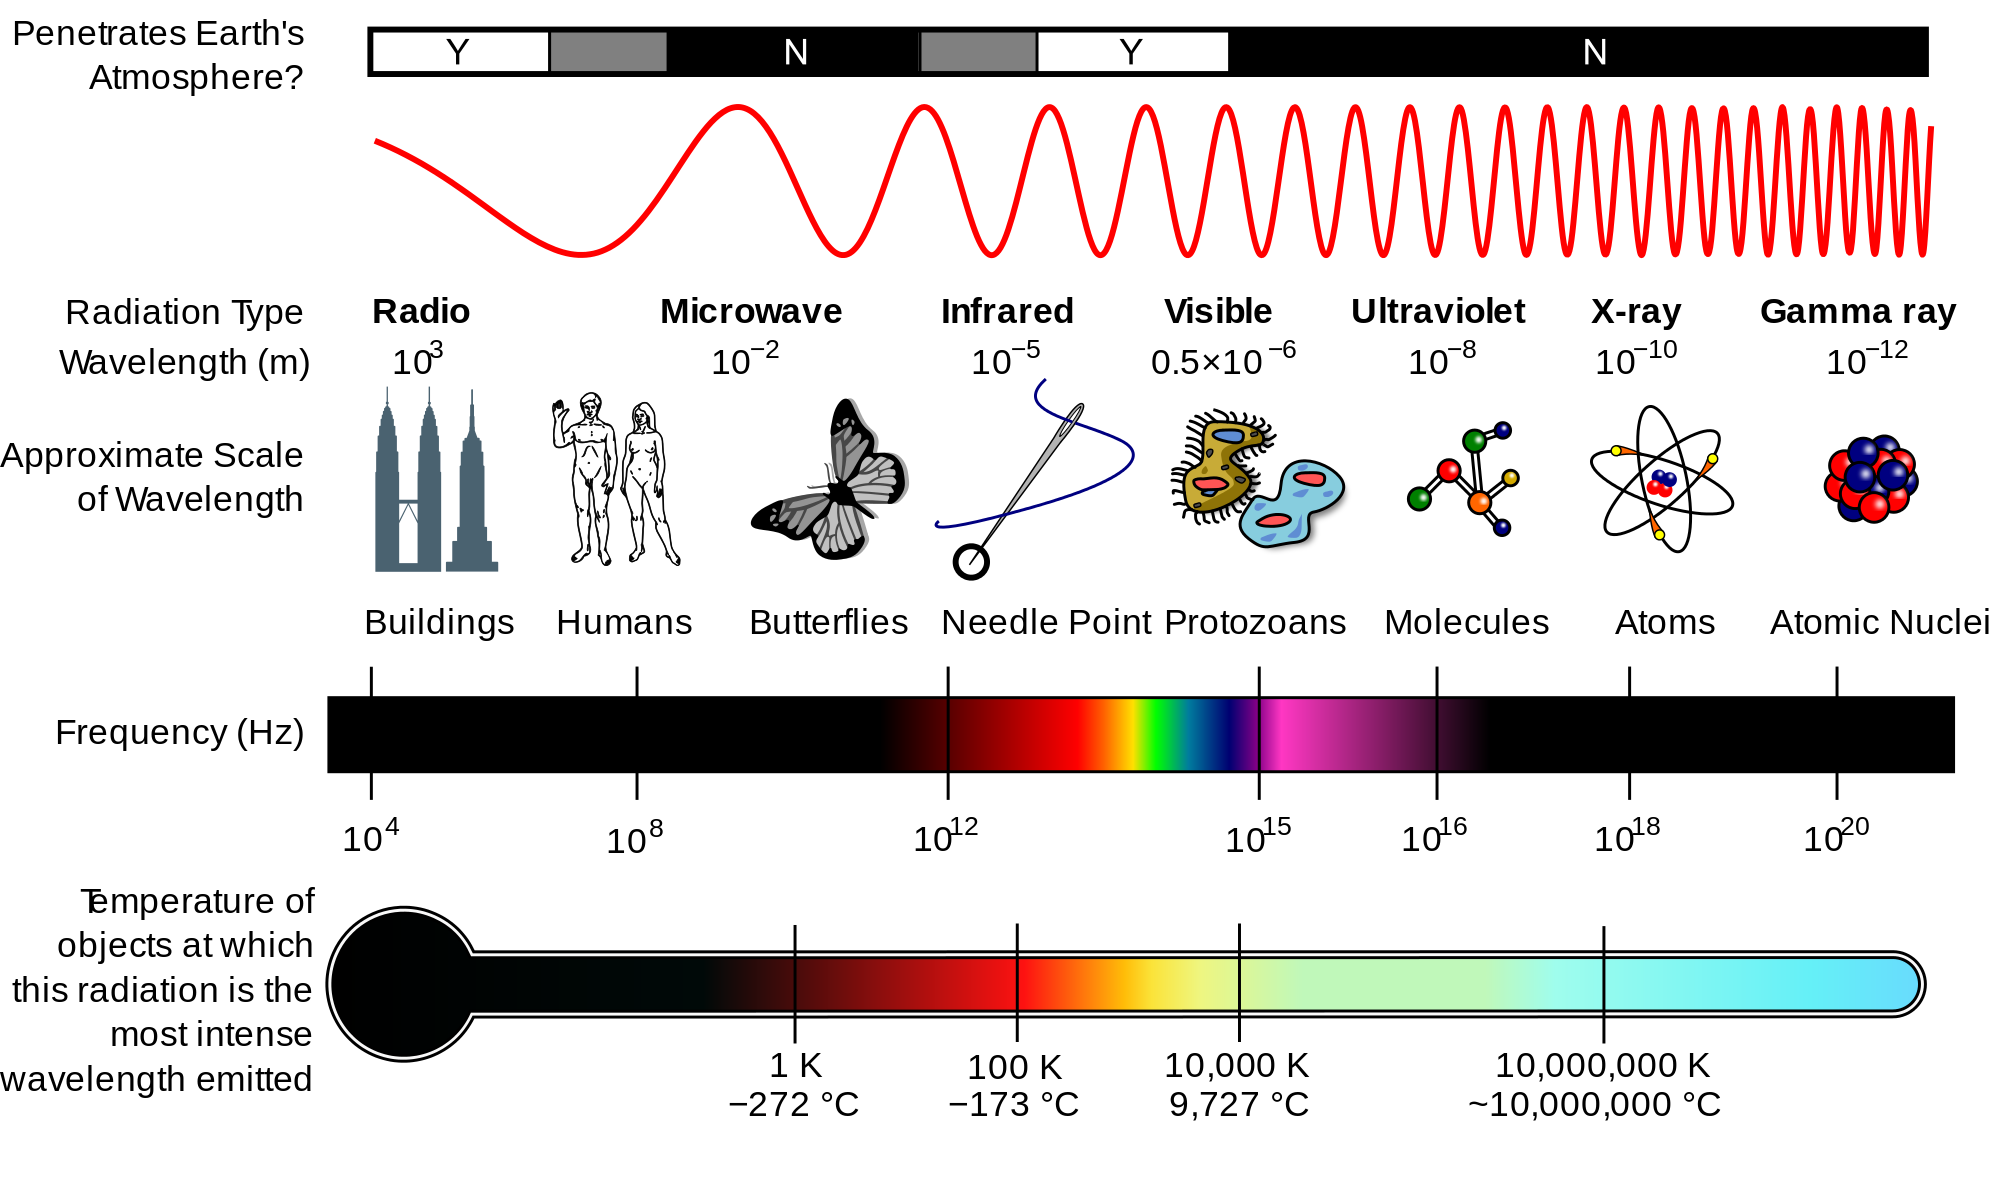
Electromagnetic waves can take on several forms such as light, radio frequency, and infrared radiation. Photo: Wikimedia.
The electromagnetic spectrum is the range of all types of electromagnetic radiation, based on wavelength. Objects to be inspected with a IR camera radiate energy measurable on the infrared spectrum. As an object heats up, it radiates more energy.
While electromagnetic radiation (light) is visible to the human eye, radiated heat is visible only to humans through thermal imaging systems. Extremely hot targets are capable of radiating enough energy to be seen by the human eye.
Important Terms
-
Infrared - Derived from the term “past red,” referring to the place this wavelength holds on the electromagnetic spectrum.
-
Thermography - Derived from root words meaning “temperature picture.” The science of using electronic optical devices to detect and measure thermal radiation.
-
Thermal signature - Infrared energy being emitted from an object at a single point in time.
-
Thermogram - An image of a thermal signature, electronically processed so that different color tones correspond to the distribution of infrared radiation over the surface of the target.
-
Qualitative thermography - Compares and contrasts the thermal signatures of similar components under similar conditions. Most electrical thermography work is qualitative, meaning that it simply compares the thermal signatures of similar components.
-
Quantitative thermography - Measurements with high levels of precision. Quantitative thermography requires a complete understanding of the variables and limitations affecting the measurement accuracy of surface temperature such as transmission, absorption, and emission.
-
Transmission - The passage of radiant energy through a material or structure.
-
Absorption - The interception of radiant energy. Infrared radiation can be absorbed in a surface, causing the temperature to change and an emission of more energy from the surface of the object.
-
Emission - The discharge of radiant energy.
Emissivity
Visible light and infrared radiation behave in similar ways. Infrared radiation is reflected by some surfaces, such as bright metals, which are often referred to as “thermal mirrors.” One of the challenges of infrared scanning is that low-emissivity surfaces, such as switchboard bus bars, emit energy inefficiently and reflect their thermal surroundings.
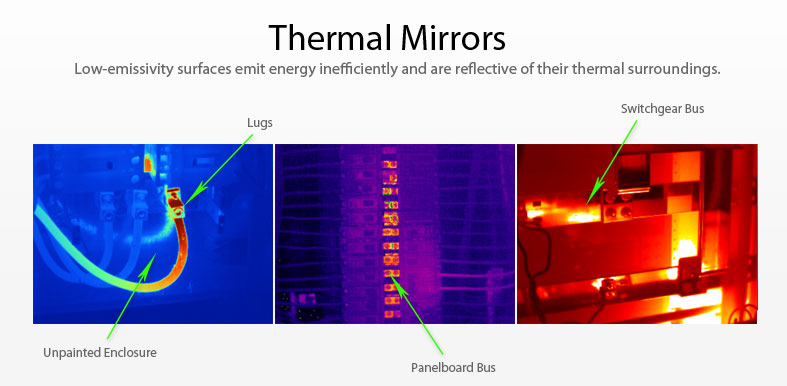
Low-emissivity surfaces, such as switchboard bus, emit energy inefficiently and are reflective of their thermal surroundings.
The amount of heat radiated by an object depends on how efficiently its surface emits infrared energy. Most nonmetallic materials, such as cable jackets or insulated bus, are efficient emitters. This means that as their temperature increases, they radiate much more energy.
Metals that are unpainted or not heavily oxidized are less efficient at radiating energy; they are known to have low emissivity. When bare metal is heated, it is difficult to see the difference between a cool and warm surface.
Emissivity can also change with surface condition, texture, temperature, and wavelength. The effective emissivity of an object can also change depending on the angle of view.
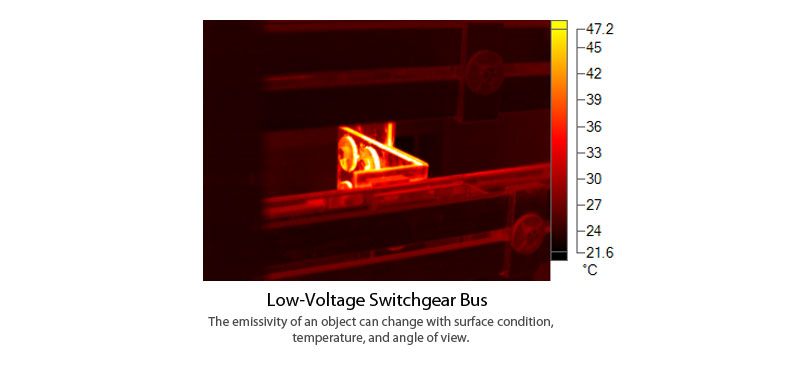
Corrections can be made for both emissivity and reflected thermal background in most camera settings and reporting software. Emissivity correction tables have been developed for many materials, which can be useful for understanding how a material will behave.
Emissivity table values should be used only as a guide since the exact emissivity of a material may vary from these values based on the variables found in tables. Low-emissivity surfaces can be altered to increase emissivity by covering them with electrical tape or paint (when safely possible).
Emissivity Values of Common Materials
| Material | Emissivity |
|---|---|
| 3M Super 33 | 0.96 |
| Aluminum, polished | 0.05 |
| Copper, polished | 0.01 |
| Copper, oxidized | 0.065 |
| Copper, oxidized heavily | 0.78 |
| Paint, average oil-based | 0.94 |
| Porcelain, glazed | 0.92 |
| Rubber | 0.93 |
| Water | 0.98 |
Infrared Camera Basics
A thermal imager is a device that detects heat patterns in the infrared-wavelength spectrum without making direct contact with equipment. Infrared radiation is focused by the camera lens onto a detector, which is read by the electronics in the thermal imaging system.
The signal produced by the thermal imager is usually generated by a change in voltage or electrical resistance, which is then converted into an electronic image (thermogram) on the display screen.
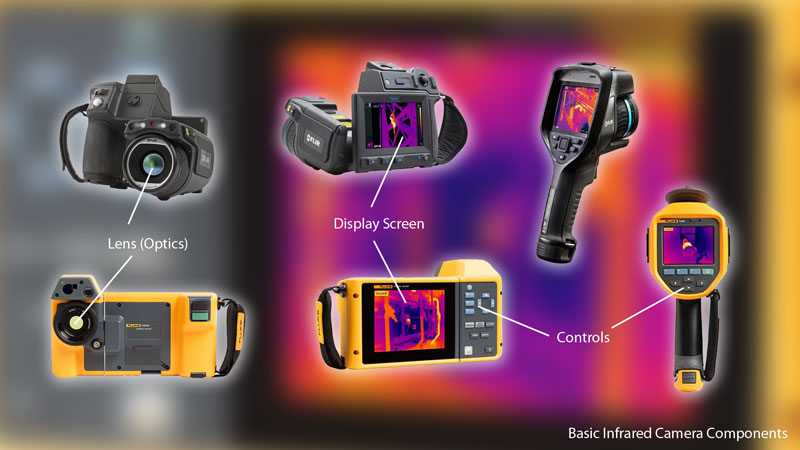
Basic Components of an Infrared Camera. Photo: TestGuy.
Infrared cameras are available in a variety of styles and resolutions. The choice of the best camera for an inspection depends on the type of equipment to be inspected and the environmental conditions.
The focal-plane array (FPA) is an image-sensing device that consists of infrared sensing detectors arranged at the focal plane of a lens. Each sensor in the array represents a single pixel on the screen.
Modern thermal imagers have FPAs that range from 16×16 to 640×480 pixels. For specialized applications, arrays are available with resolutions in excess of 1000×1000 pixels.
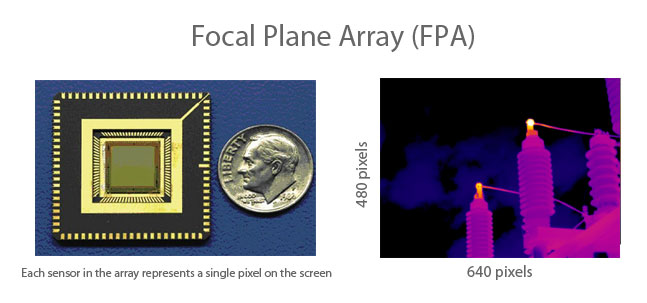
The focal-plane array is an image-sensing device that consists of infrared sensing detectors arranged at the focal plane of a lens.
An array of 160×120 is equal to 19,200 total pixels (160 pixels × 120 pixels = 19,200 total pixels). The more pixels, the sharper and more detailed a thermal image will appear.
Thermal imaging systems in the 1970s displayed thermal images through the use of black and white cathode-ray tubes (CRTs). In the late 1980s, the release of the focal-plane array brought significant improvements to image quality and spatial resolution.
The first experiments with infrared took place in 1800, but it was not until the 1960s that thermal imaging was used for nonmilitary applications. Early thermal imaging systems were cumbersome, slow, and had very low resolution.
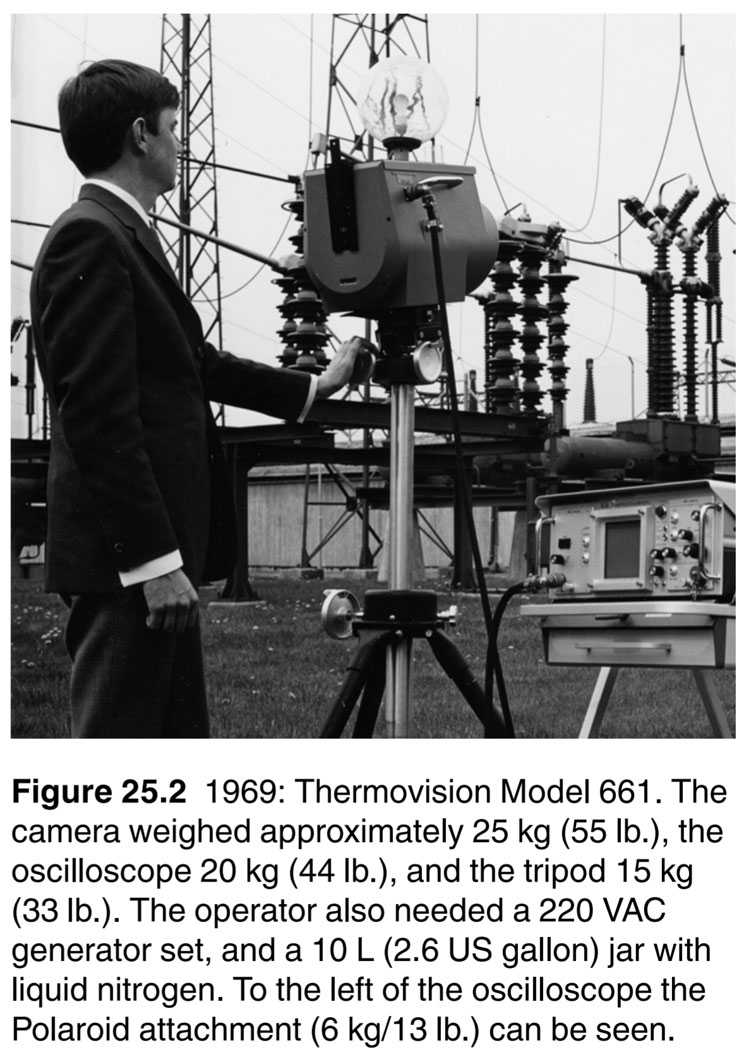
Outdoor substation infrared scan, circa 1969. Photo: FLIR Systems.
Important Safety Considerations
Thermographic inspections of electrical systems pose great risks, and only qualified persons should perform infrared scans at a safe distance while following all appropriate safety regulations. The process involves scanning energized equipment, which can trigger a phase-to-phase or phase-to-ground arc flash when enclosures are opened.
An arc flash is an extremely high-temperature explosion produced by an electrical fault. The flash protection boundary is the minimum distance at which personal protective equipment (PPE) is required for the prevention of burns if an arc flash occurs.
Related: NFPA 70E Arc Flash and Shock Hazard Boundaries Explained
The radiant energy released by an electric arc is capable of permanently inuring or killing a human being at distances of up to ten or even twenty feet. Photo: TestGuy.
Opening a door can trigger an arc flash if the latch is defective or objects (pests or dust and debris) inside the enclosure are disturbed. Barriers, along with the proper PPE, must be used to protect against the dangers of an arc flash.
Related: Electrical Shock and Arc Flash PPE Overview
It’s important to note that a person may be qualified to perform infrared scans but may not be qualified to remove covers, making equipment accessible for inspection. By the same token, a person may be qualified to make equipment accessible but not qualified to perform thermographic inspections.
Related: NFPA 70E: Who is a “Qualified Worker?”
Electrical shock is another hazard to consider, especially when working around open electrical equipment in small areas, such as an electrical closet. While the act of infrared scanning itself doesn’t require contact with equipment, voltage and current measurements may be necessary and pose a shock hazard to qualified persons.
Related: How Electricity Affects Your Body
A safe-work plan or job hazard analysis (JHA) should always be developed and followed prior to inspection. Aside from electrical risks, working in any industrial environment requires being aware of other hazards, including the potential for trips and falls and enclosed-space entry.
Performing a pre-task “walk-down” of the planned inspection route can be useful to identify any possible safety concerns or inefficiencies.
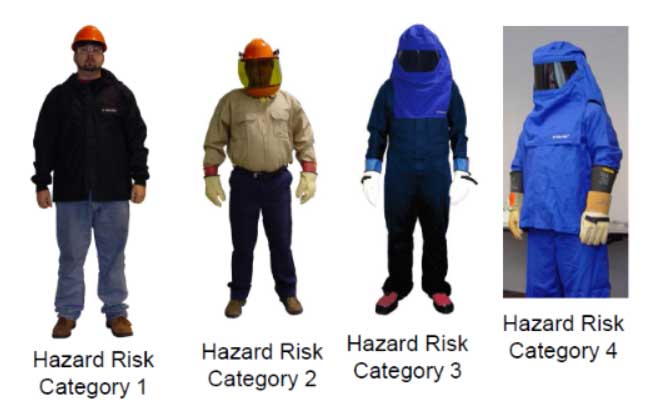
The greater the electrical hazard, the higher the personal protective equipment arc rating must be to withstand an arc-flash incident. Photo: EFCOG Electrical Safety Task Group.
Infrared Inspection and Testing Procedures
When performing infrared scans on electrical systems, components and equipment should be under normal operating conditions and viewed directly with covers removed wherever safely possible. During an inspection, particular attention is given to any electrical connection or point of electrical contact.
Electrical connections and points of contact along a current path are susceptible to heat caused by abnormally high resistance and are the primary sources of system failures. Current imbalances between phases and abnormal heating among components can be easily detected.
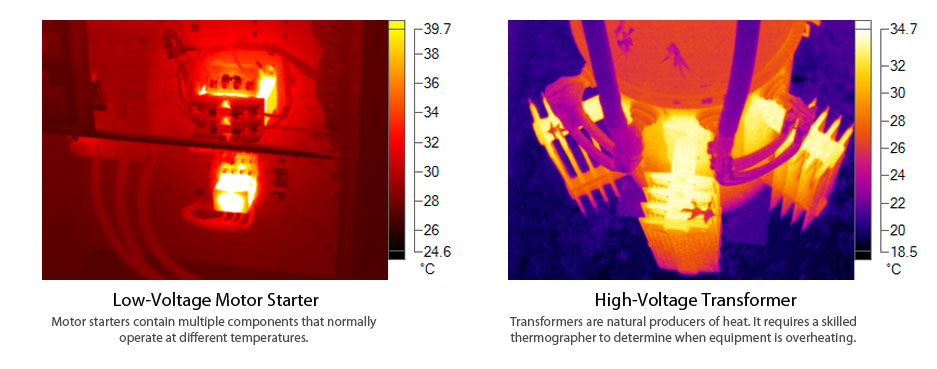
The key to successful thermal imaging of power systems is having a good understanding of the basic operating principles of each piece of equipment. Motor starters, for example, contain multiple components that normally operate at different temperatures. Transformers and rotating machinery are natural producers of heat.
Temperature is often not a reliable indicator of the severity of a problem because many factors can cause it to change. Problems can be mistakenly missed when a component or piece of equipment is not particularly hot. This is why it’s important to note the equipment load conditions at the time of inspection.
In some instances, problems may be suspected, but there will not be similarly loaded equipment to compare to. In this case, the area of concern is compared to ambient temperature, taking note of any environmental conditions that could affect the reading.
The temperature of an electrical connection varies as the load changes. The heavier the equipment load, the better an indication of the hot spots.
A “hot spot” can be caused not only by excessive resistance but also may arise from:
- thermal reflections
- solar gain
- eddy current inductive heating
Its critical to be aware of these factors in order to identify a true hot spot.
NETA standards recommend that infrared scans be performed with a minimum of 40% load or at the highest normal load whenever possible. Special care should be given to any discrepancy found on lightly loaded equipment where the load is likely to increase over time.
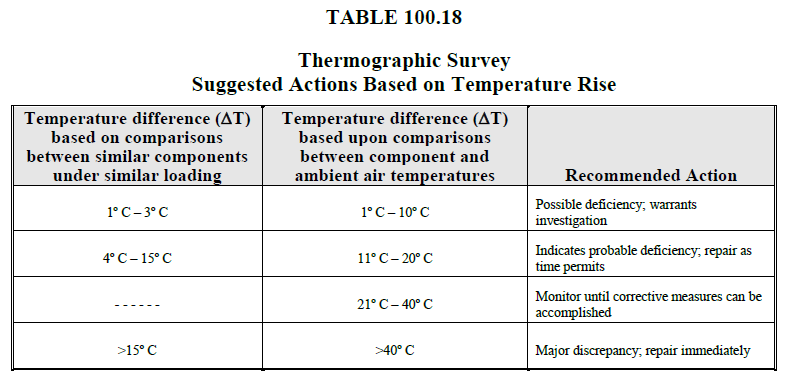
NETA Table 100.18 is used to determine action levels based on temperature rise. Photo: NETA-MTS 2015
Focus is most important!
The focus of a thermal imager is critical. An out-of-focus camera leads to incorrect temperature measurements and low-quality reports. You can gain the best image results by holding the camera tight and close to your body. Try to achieve the sharpest lines possible when adjusting the focus.
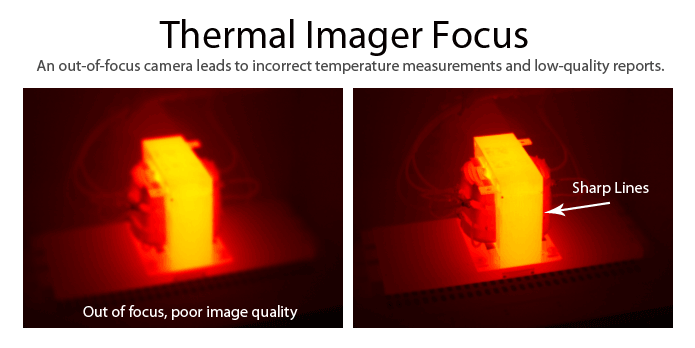
Correct focus is the most important factor when collecting thermal data.
Once a thermal image is saved to memory, all variables such as emissivity and background temperatures can be changed at any time in reporting software. Focus is the only variable that can’t be changed, so be sure to focus on your focus!
Temperature Scale and Thermal Tuning
Each pixel on a thermogram corresponds with a color on the temperature scale. The range of this scale from the lowest temperature to the highest is known as the dynamic range.
Blind usage of the “auto temperature scale” key on an infrared camera produces nice images but can be misleading. When scanning outdoor substations, using the auto-scale button will set the level and span to extreme values and “wash out” the image.
This greatly reduces the thermal contrast so much that hot spots cannot be detected. In these cases, the dynamic range (temperature scale) should be set to a minimum by manually adjusting the upper and lower temperatures.
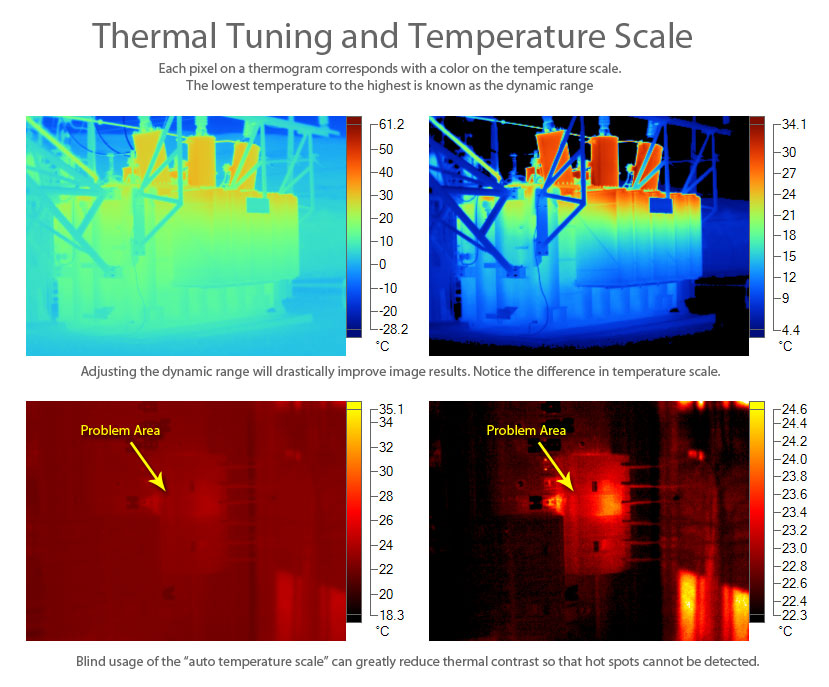
The dynamic range and temperature scale of a thermogram should be optimized for best image quality.
Color Palettes
A palette is the color scheme used to display the thermal signatures in a thermal image. The objective is to select the palette that best identifies and communicates the problem.
For example, certain applications may be better viewed and analyzed in a monochromatic palette such as grayscale or amber tones. Other situations may be easier to analyze and explain in a color palette such as blue-red or one with high contrast.
Color palettes and the dynamic range of an image go hand in hand. The blue-red palette is the most easily understood, but it can be very misleading if the correct dynamic range is not applied - cool components can easily be made to look red, and hot components can easily appear less severe, depending on the temperature scale range.
The Importance of Visual Inspections
Natural senses, such as eyesight and smell, can provide useful information that may not be detectable by thermal imagers during times of light loading.
Before scanning each piece of equipment, a visual inspection should be performed to search for any evidence of overheating, such as discolored wire insulation or deformed pieces around bare conductors.
Load measurements should be taken after equipment is scanned and visually inspected to avoid disturbing any possible loose connections.
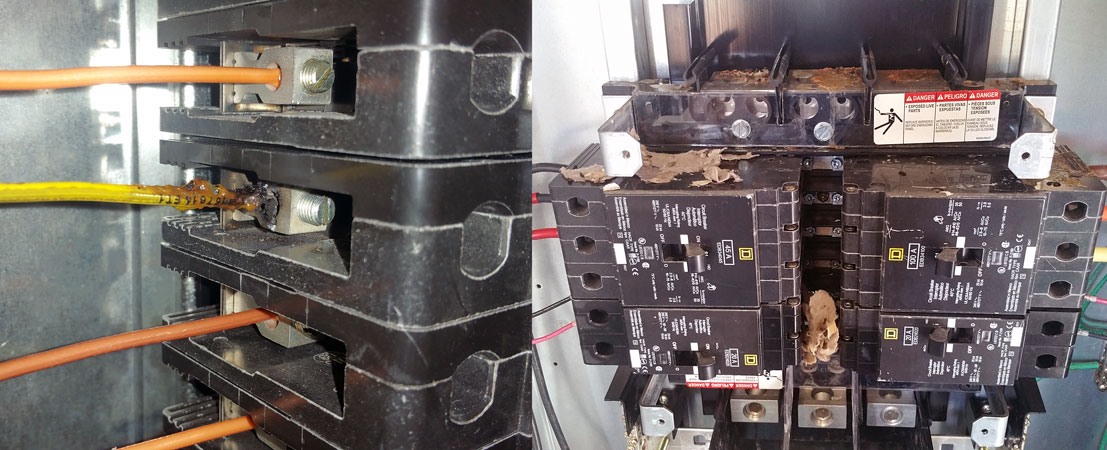
Loose connections may not be detectable by an infrared camera during times of light loading. Thermographic inspections are a great opportunity to evaluate and prioritize equipment for maintenance outages.
Environmental Considerations
Factors such as wind speed, rain, snow, solar interference, and strong magnetic fields can affect infrared survey results. Viewing an image on a display screen while outdoors can often be challenging as well. An ideal time to scan outdoor equipment would be in the early morning or late afternoon when solar interference is at its lowest.
It’s important to be aware of these factors and take note of any special environmental conditions at the time of inspection. Ambient temperature and humidity should always be recorded for each work location and included in the final report.
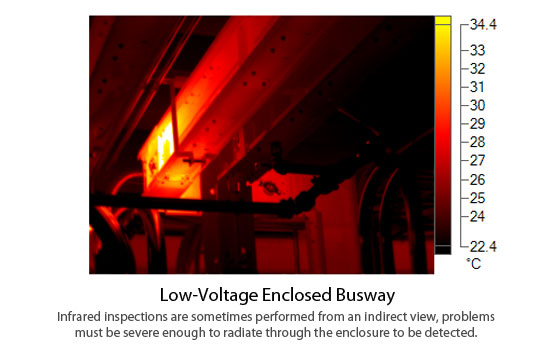
Special Applications
Infrared inspections are sometimes performed from an indirect view, such as looking at an enclosed overhead busway. While this may be a necessary alternative in some situations, it may not provide the desired results on its own if the problem isn’t severe enough to radiate through the enclosure.
Some equipment may be so difficult and/or dangerous to access that other inspection measures are required, such as the use of a viewport or an infrared transparent window. Other technologies and test methods, such as airborne ultrasound, can also be used in these instances.
Root Cause Analysis
Sometimes thermal results cannot be interpreted, but they provide an indication that other tests may be necessary to pinpoint problem areas. It is useful to employ other types of testing, such as vibration or motor circuit analysis, in conjunction with infrared scans.
For example, a transformer winding may show an increase in temperature with no load imbalance or visual signs of loose connections. Upon further investigation, electrical tests reveal that the internal resistance of the winding has increased.
Inspection Results and Report Writing
Infrared reports can come in many styles and include a variety of data. In accordance with industry standards, thermographic reports for electrical systems should include the following information:
-
Description of equipment to be tested. Identify the location of equipment and the designation or special ID.
-
Discrepancies. This includes non-thermal related items, such as electrical code violations or safety hazards that may be noted along the way.
-
Temperature difference between the area of concern and the reference area. Utilize temperature points in the reporting software to identify discrepancies.
-
Probable cause of temperature difference. The most common problems found among electrical systems are loose connections, overloaded circuits, weak contacts, and aging insulation.
-
Areas inspected. Identify inaccessible and/or unobservable areas and/or equipment. List any critical equipment not inspected or along with explanations for the omission.
-
System load conditions at time of inspection. System conditions of interest would include load (ampere draw), percent load of total rating and duty cycle.
-
Ambient environmental conditions. Record relevant data such as wind speed, wind direction, precipitation, humidity, and ambient air temperature.
-
Photographs and/or thermograms. Provide a side-by-side infrared and visible light image of the deficient areas for each piece of equipment.
-
Recommended action for repair. Provide corrective measures for discrepancies and request a follow-up infrared image to document any repairs made.
-
Make, model, and serial number of thermal imager. Also include any instrument parameter settings, such as emissivity and background temperature.